
A society can change before it realizes it has changed. It can also tell itself that change is complete while opportunity, authority, habit, and expectation remain uneven. To interpret culture well, we have to learn to see those different clocks—and then ask what kinds of decisions can come to seem reasonable inside the mismatch.
The question behind the choice
Our earlier article, “Why Risk Can Feel Reasonable”, began inside a decision. It asked why a young person might choose something dangerous even when the danger is known. Our working interpretation was not that information is useless or responsibility disappears, but that people do not make choices from a distance. They make them inside a lived situation—under pressure from belonging, identity, relief, fear, status, affection, and whatever future they can presently imagine.
That inquiry led to a question one level deeper.
Before people choose, they interpret. What do people like me normally do? Which roles are open to me? What will earn respect? What will cost me belonging? How does someone actually become a husband, wife, parent, professional, neighbor, leader, provider, caregiver, or trusted friend? Which of those futures feels possible from here?
Culture helps answer those questions, often before a person knows they are being asked.
But “culture” can become a lazy explanation. We use the word as though it were a single force moving in one direction. It is not. Law may change before habit. Educational pipelines may change before professions. Professions may change before leadership. Family expectations may persist after economic conditions have shifted. Public narratives may describe a world that no longer exists—or announce a new world that has not yet arrived for everyone.
People then make decisions amid conflicting maps. A role can be formally available but socially unrewarded. A life can be culturally praised but materially unreachable. A pathway can be economically necessary but poorly understood. An older script can retain moral power after the institutions that once supported it have weakened.
This is where interpreting cultural trends becomes more than counting who is ahead. The deeper task is to understand what changed, which layer changed, how quickly it changed, and what that change means inside an actual decision.
We began with a story—and let the evidence correct it
The questions that prompted this work were morally serious. Abraham Humphrey’s observations about relationships, substances, digital life, and changing expectations raised a familiar possibility: perhaps a generation had crossed some cultural threshold and simply become more willing to make unhealthy choices.
That is a plausible story, but is it an accurate interpretation of data?
When we examined national youth trends for the earlier article, several behaviors often treated as evidence of broad generational decline had actually fallen. Other indicators—especially persistent sadness and hopelessness—had risen. The pattern was not a clean descent from responsibility into recklessness. It was mixed behavior inside a changing environment.
That correction mattered. It moved us from “When did the culture go bad?” to more answerable questions:
Which behaviors actually changed, among whom, and over what period?
Which behaviors became more visible without becoming more common?
Which norms do people believe their peers hold, and are those beliefs accurate?
Which institutions, incentives, and technologies changed the options people experience?
What immediate human problem does a harmful choice appear to solve?
Evidence is not only a tool for confirming concern. It is a tool for disciplining concern. A compelling story may tell us where to look, but it cannot tell us in advance what we will find.
That principle became even more important when the conversation turned to sex-patterned social change. It would have been easy to assemble a catalogue of female gains and male losses, or to declare that historically familiar roles had simply reversed. The data did not support either conclusion. Instead, they revealed several different kinds of movement that are often compressed into one word: reversal.
The better word is realignment.
A driver’s license changed the question
The humble driver’s license offered the first clue.
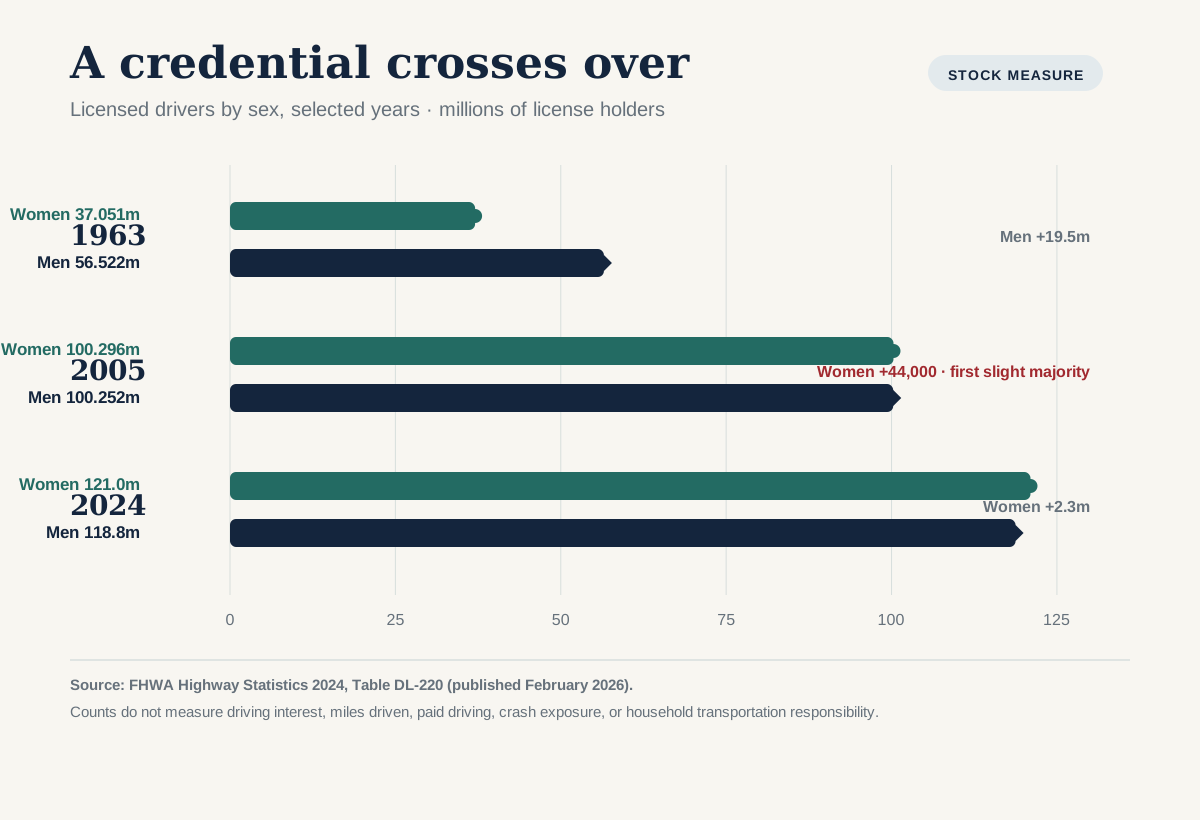
In 1963, the Federal Highway Administration counted about 56.5 million licensed male drivers and 37.1 million licensed female drivers. The totals nearly converged by 2004. In 2005, women became a slight majority of license holders—100.296 million women and 100.252 million men. By 2024, the totals were about 121.0 million women and 118.8 million men. (FHWA Table DL-220)
It is a striking crossover, but what does it mean?
It does not establish that women became more interested in driving than men. A total count is affected by the size and age structure of the population, longevity, cohort replacement, and state reporting practices. It does not tell us who drives farther, who drives for paid work, who bears more crash exposure, or who is responsible for a household’s transportation. It tells us something narrower and still important: the accumulated population holding this once strongly male-patterned credential became slightly female-majority.
That distinction opened a broader inquiry. If licensing had crossed over, where else had participation, credentials, professions, or civic behavior realigned? And were those changes all the same kind of event?
They were not.
What, exactly, has crossed?
The word reversal can conceal several different measurements. Before interpreting a crossover, we must identify which layer changed. Seven measures keep the story honest.
Across a cultural transition, at least five clocks may be moving: access and permission, behavior and participation, the pipeline, the accumulated population and its authority, and the public narrative about what is normal. The seven measures below help us tell which clock a statistic is actually reading.
Measure | What it can show | What it cannot establish by itself |
|---|---|---|
Stock | The accumulated population currently holding a credential or occupying a role | Who is entering now, or why the composition changed |
Flow | New entrants, graduates, hires, exits, or awards during a period | The composition of the accumulated population |
Pipeline | Representation at successive stages leading toward a role | That every entrant will remain, advance, or reach authority |
Participation rate | The proportion within each group taking part | The composition of all participants without population denominators |
Authority | Who controls decisions, resources, ownership, or leadership | What headcount alone means for influence |
Intensity | Hours, tenure, earnings, responsibility, exposure, or unpaid load | Whether someone is merely counted as present |
Risk | Who bears physical, financial, legal, relational, or social downside | Who receives the visible status or benefit |
These measures are related, but they do not move together.
A durable educational crossover
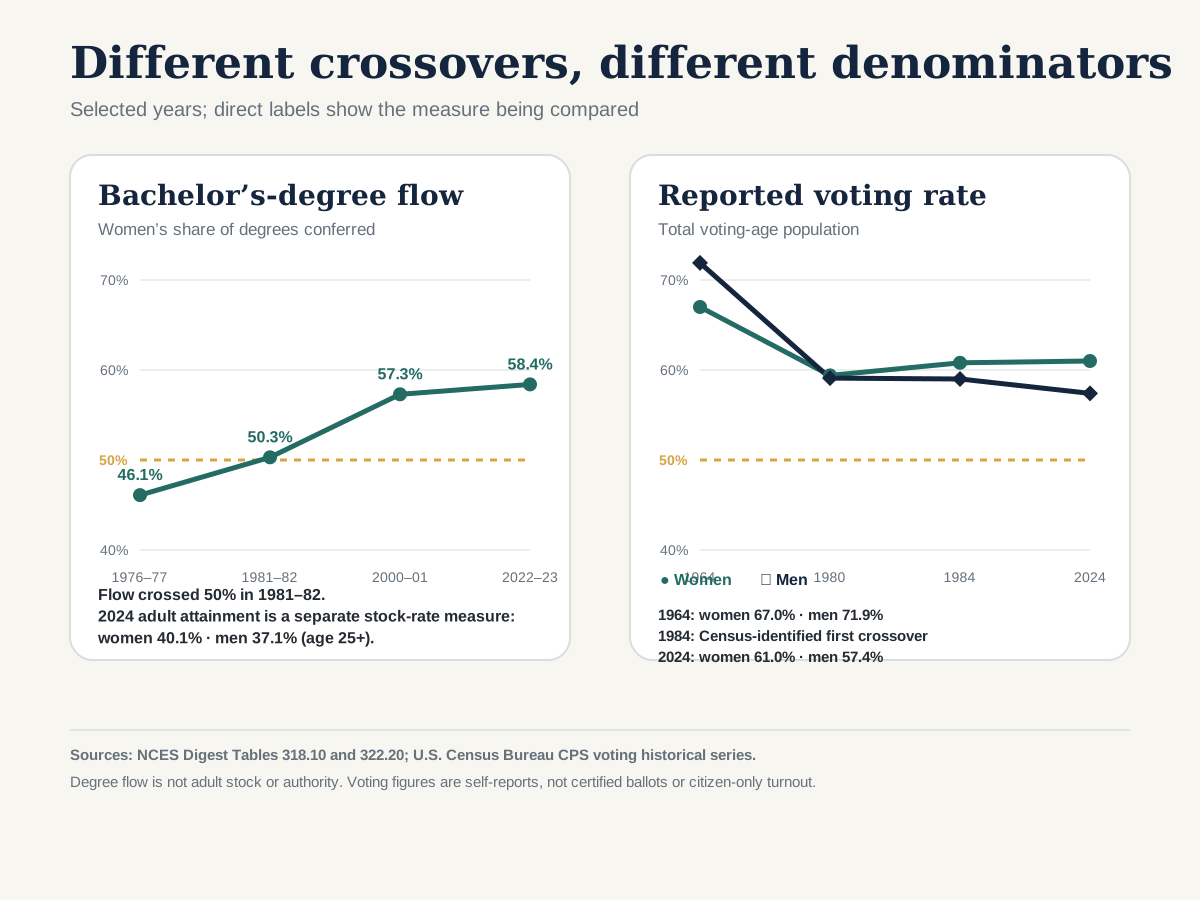
Women became a slight majority of U.S. bachelor’s degree recipients in the 1981–82 academic year: 50.3 percent. By 2022–23, they received 58.4 percent. (NCES, historical Digest Table 318.10; Digest Table 322.20)
The accumulated attainment pattern has now crossed at the population-rate level: in 2024, 40.1 percent of women age 25 and older held at least a bachelor’s degree, compared with 37.1 percent of men. (U.S. Census Bureau)
This is not merely a one-year fluctuation or an incoming-class pattern. It is a durable flow crossover now reflected in adult attainment rates. Yet even here, the national average does not describe every field, race, region, income group, or community. Nor does earning more degrees automatically reveal who holds authority, accumulates wealth, or bears family responsibilities.
Occupational stock crossovers do not settle the authority question
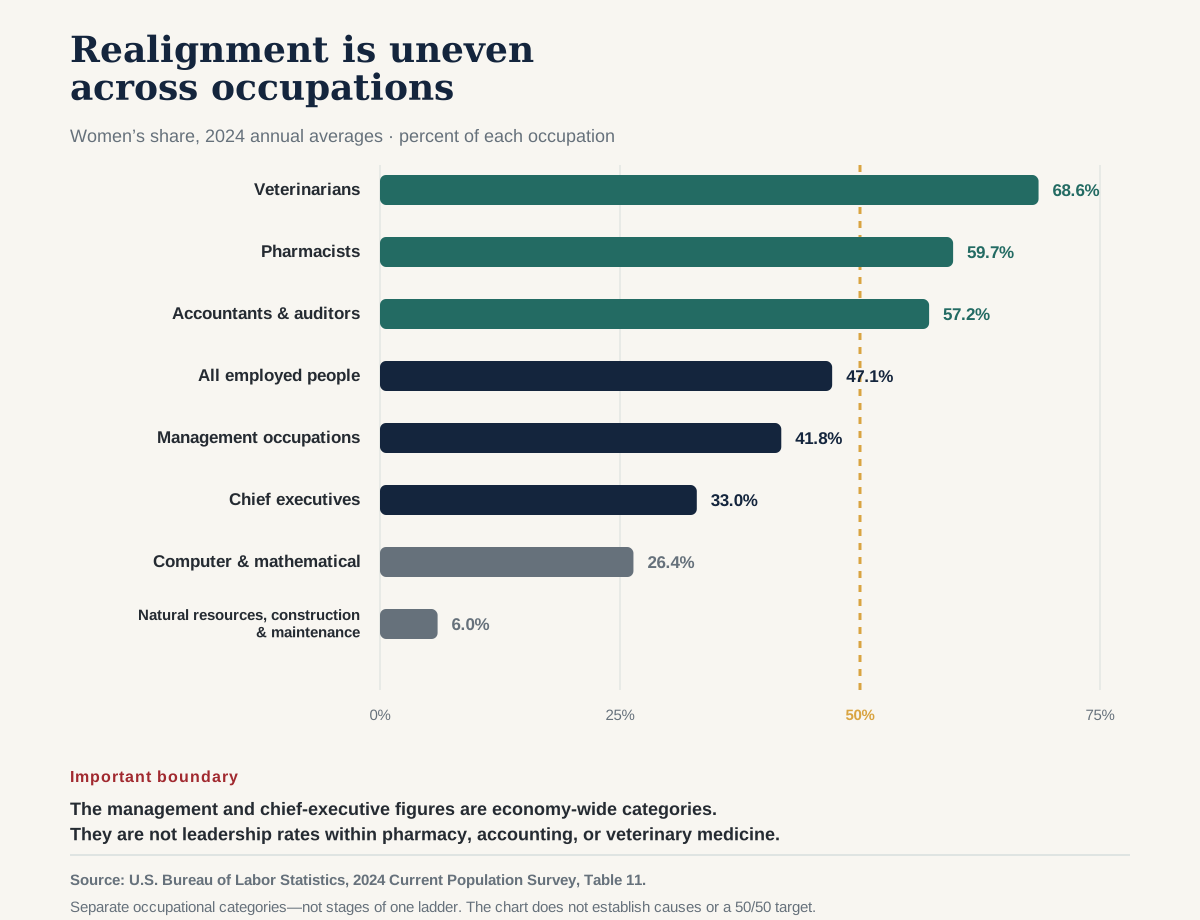
In the Bureau of Labor Statistics’ 2024 annual averages, women were 59.7 percent of pharmacists, 57.2 percent of accountants and auditors, and 68.6 percent of veterinarians. Women were also 47.1 percent of all employed people. Yet they were 41.8 percent of workers in management occupations and 33.0 percent of chief executives. (BLS, 2024 Current Population Survey, Table 11)
These figures do not establish a leadership gap within pharmacy, accounting, or veterinary medicine. They show that occupational composition and economy-wide representation in management and chief-executive roles are different measurements. Determining whether authority lags within a particular profession requires profession-specific evidence about ownership, rank, decision rights, and leadership. Change is real, but it is layered.
Realignment is also highly uneven. In the same 2024 table, women were 26.4 percent of workers in computer and mathematical occupations and 6.0 percent of workers in natural-resources, construction, and maintenance occupations. Change in one domain does not establish a universal direction in every other domain.
Historical comparisons require another caution. Federal summaries show that women were 12.1 percent of pharmacists and 24.6 percent of accountants in 1970. Those figures come from a decennial Census-based system, while the 2024 figures come from the Current Population Survey. They establish the broad direction of change, but they should not be treated as one perfectly harmonized time series. (U.S. Census Bureau historical summary)
A participation-rate crossover
Voting offers a different pattern. Census Bureau historical tables based on self-reports show that, among the total voting-age population, men reported voting at higher rates than women in 1964: 71.9 percent compared with 67.0 percent. The point estimates were nearly tied in 1980—59.4 percent for women and 59.1 percent for men—but Census publications identify 1984 as the first presidential election in which women’s reported voting rate exceeded men’s. From 1984 onward, women had the higher reported rate in every listed presidential and congressional election. In 2024, the total-voting-age-population series reported rates of 61.0 percent for women and 57.4 percent for men. (Census voting historical series)
This is a rate comparison, not simply a count of voters. It is also based on the Current Population Survey, not certified ballots, and uses the voting-age population rather than only eligible or registered citizens. The bounded conclusion is that reported electoral participation realigned; the table alone cannot tell us why.
A pipeline can cross long before a profession does
Medicine and law reveal another clock.
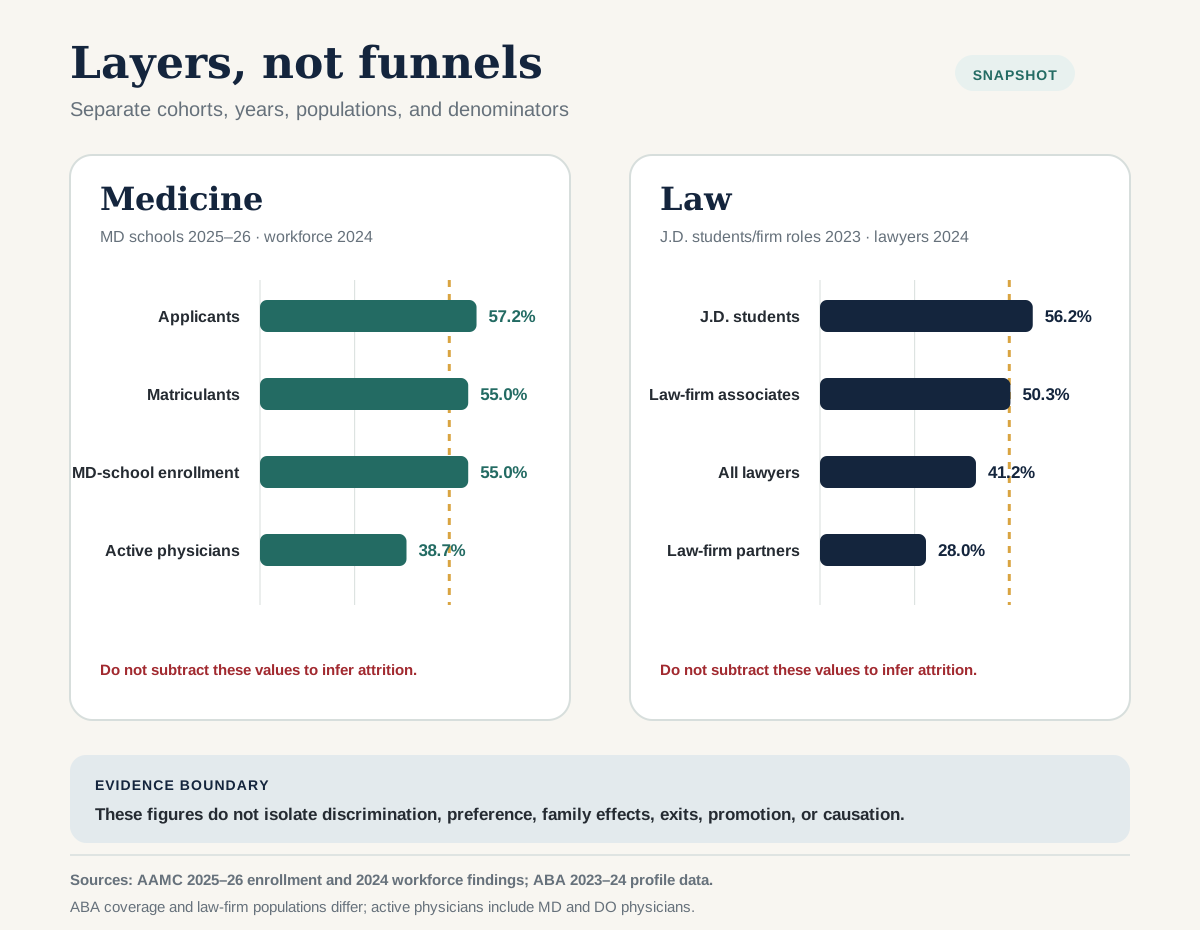
For the 2025–26 academic year, women were 57.2 percent of applicants, 55.0 percent of matriculants, and 55.0 percent of total enrollment across U.S. MD-granting medical schools. Yet women were 38.7 percent of the active physician workforce in 2024. (AAMC enrollment data; AAMC physician-workforce findings)
The American Bar Association reports a similar layering. Women were 56.2 percent of J.D. students in 2023, while the ABA’s 2024 profile placed women at 41.2 percent of lawyers; not every state reports lawyer gender. Its 2024 profile report, using 2023 law-firm data, found women at 28 percent of partners even as they became a slight majority of associates at 50.3 percent. (ABA legal education; ABA lawyer-population comparison; ABA profile report)
None of this is contradictory. A pipeline consists mainly of newer cohorts. A professional stock includes decades of earlier cohorts. Leadership is narrower still and reflects promotion, specialization, tenure, hours, exits, opportunity, family decisions, discrimination, preference, and institutional practice. The numbers describe where the layers are; they do not, by themselves, isolate the weight of each cause.
There is no single march toward 50/50
These patterns resist a simple ideological story.
They do not show that men and women have exchanged identical social positions. They do not show that every domain is moving toward parity. Descriptive data alone cannot tell us whether a particular distribution is fair, freely chosen, or desirable; those judgments require additional evidence and explicit moral reasoning. And the data do not show that gains by one sex mechanically caused difficulties for the other.
They show that different roles are changing in different ways.
One domain can experience a durable stock crossover. Another can have a female-majority pipeline but a male-majority profession. A third can reach numerical balance while authority or risk remains unequal. A fourth can converge without crossing. A fifth can remain strongly sex-patterned. Within each, the movement may differ by age, race, class, geography, family structure, and cohort.
Evidence posture: Describing a sex-patterned change is not assigning blame, declaring one sex superior, or deciding what every individual ought to choose. Aggregate patterns do not explain an individual, and a difference in representation is a finding that calls for explanation—not an explanation in itself.
Life that Counts does not pretend to be morally neutral. We value faithful marriage, responsible parenthood, self-command, meaningful work, service, protection from coercion and abuse, and relationships in which dignity and responsibility reinforce one another. Those are organizational judgments, not conclusions produced by demographic tables. Keeping the distinction explicit allows us to argue for them without asking the data to perform moral work they cannot do.
This posture allows two truths to remain visible at the same time. Expanded opportunity for women is real and historically consequential. Evidence of disengagement or difficulty among particular groups of men, where it exists, deserves direct study rather than being inferred from women’s gains. Concern for one does not require contempt for the other.
The task is not to choose a side in a numerical contest. It is to understand the social transition well enough to help people build honorable, attainable lives within it.
The social map before the choice
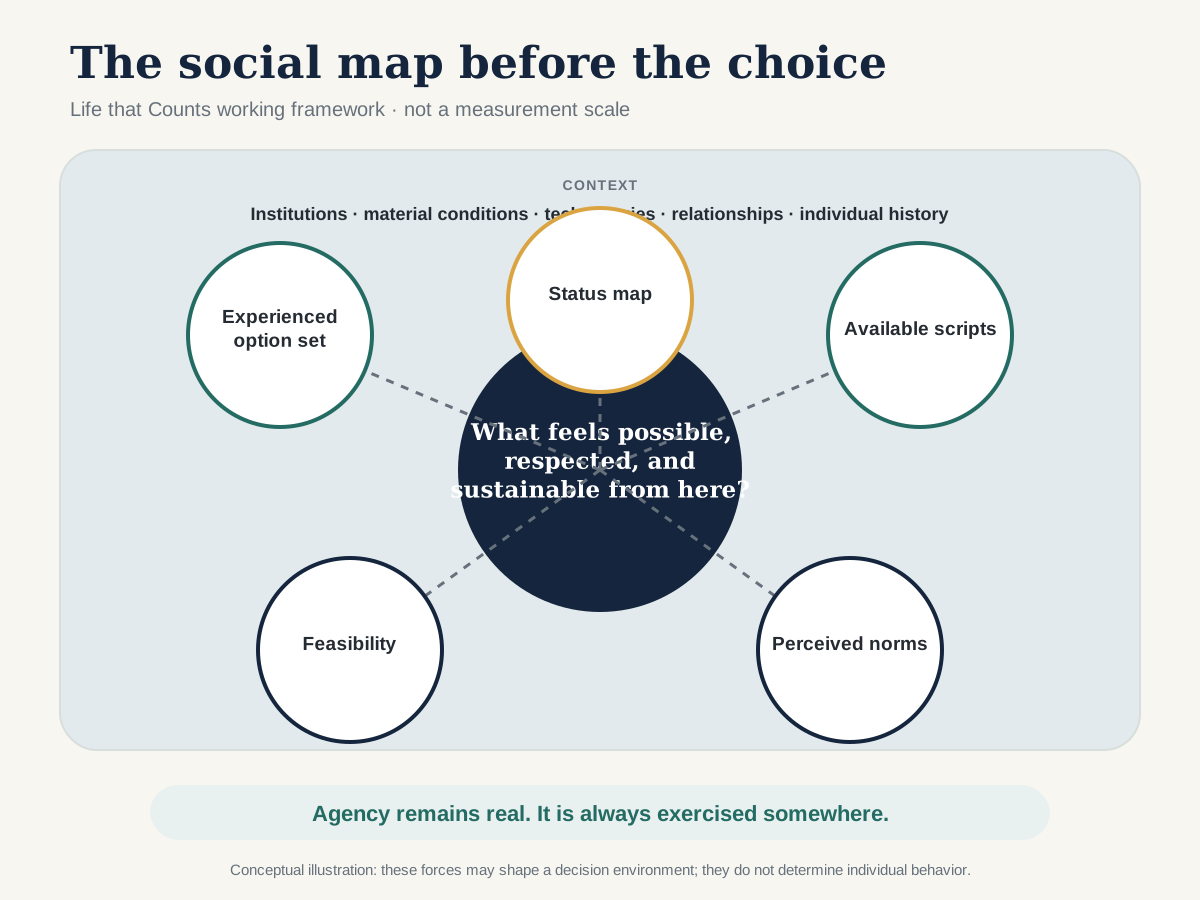
Culture helps supply meanings, norms, and scripts, but it does not create the whole map. Institutions, material conditions, technologies, relationships, and individual histories also shape what a person can see, afford, imagine, and sustain. The data above become relevant to decision-making when these forces alter the map people use to navigate ordinary life.
Five features of that map matter.
The experienced option set: “What can someone like me actually do?” Formal freedom is larger than experienced freedom. A pathway may exist on paper but remain invisible because no trusted person has modeled it, no local institution offers it, or the person cannot imagine belonging there.
The status map: “What will earn respect, belonging, or shame?” Choices carry social meanings. The same job, relationship, sacrifice, or request for help may be honored in one group and ridiculed in another. People often protect social survival before abstract consistency.
The available scripts: “How does a person actually do this?” Wanting a stable marriage is not the same as knowing how to court, communicate, repair conflict, manage money, share responsibility, or remain faithful under strain. Wanting a career is not the same as knowing how to enter a field, tolerate being a beginner, seek a mentor, and recover from rejection.
Feasibility: “Can I reach and sustain it?” Money, time, transportation, housing, childcare, health, local opportunity, and institutional friction change the real cost of a choice. A value without a viable pathway can be heard as a lecture.
Perceived norms: “What do people like me do and approve?” People respond not only to actual behavior but to what they believe is common and admired. A vivid minority can dominate attention. A platform can amplify an extreme. Silence can make a healthy majority invisible.
These features do not program a person like software. Emotion, development, prior experience, trauma, immediate need, and time horizon filter the map. Agency remains real. But agency is always exercised somewhere.
Culture helps tell us what a choice means. Institutions shape whether a pathway exists. Material conditions affect what it costs. Relationships signal what will be rewarded or rejected. The person still chooses.
A shared institution can produce different experienced maps
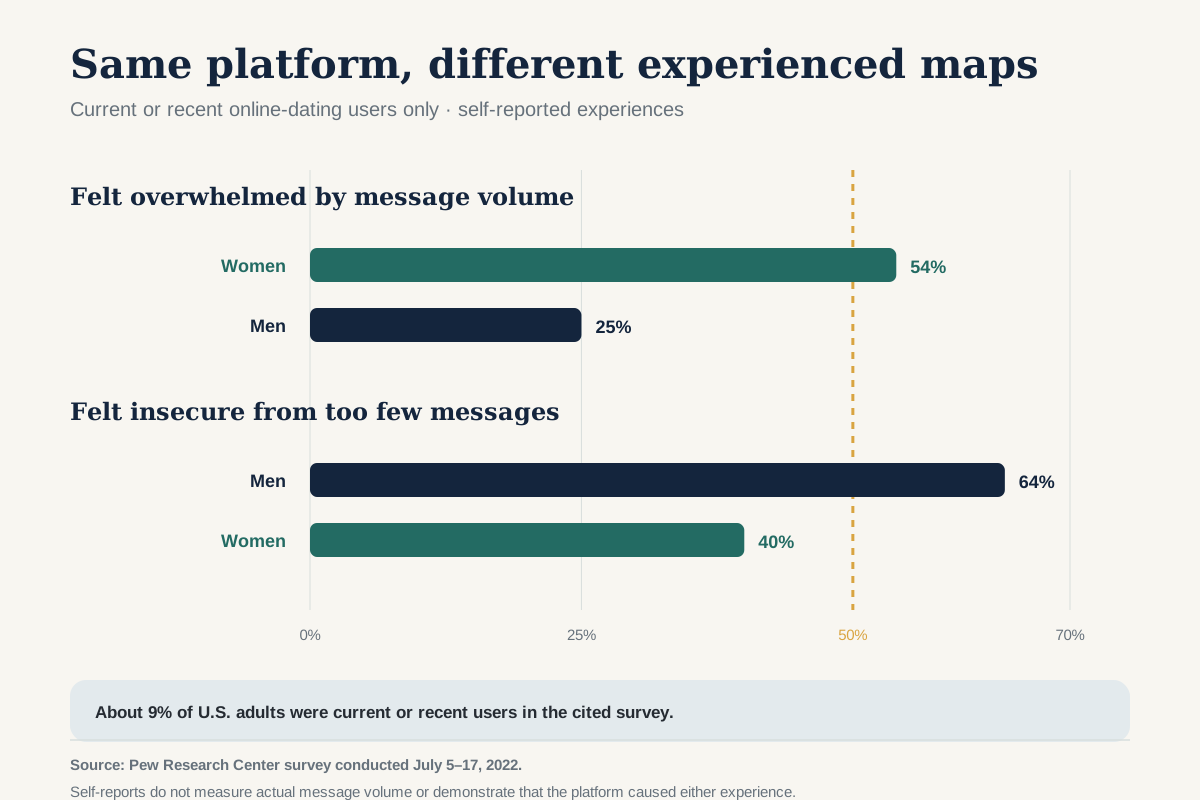
The preceding examples operate across decades. Online dating offers a narrower, immediate illustration of the same principle: people can enter the same institution and encounter materially different experienced option sets.
In a 2022 Pew Research Center survey, women who had recently used online dating were more likely than men to say they felt overwhelmed by the number of messages they received: 54 percent compared with 25 percent. Men were more likely to say they felt insecure because they received too few messages: 64 percent compared with 40 percent. These current or recent users represented about 9 percent of U.S. adults. (Pew Research Center)
The point is not that every woman experiences abundance or every man experiences scarcity. The estimates apply to current or recent users, not all adults. These self-reports are consistent with uneven experiences of attention and with different perceived dating environments; they do not establish that the platform caused either experience. One user may have to manage excess attention and threat; another may interpret silence as evidence of low worth. Both may be navigating the same platform through markedly different experiences.
That nuance matters because a popular account of “male loneliness” can easily outrun the evidence. A 2025 Pew analysis found no significant difference between men and women in reported loneliness or in the number of close friends. It did find that men turn to their networks less often for several kinds of emotional and social support. (Pew Research Center)
The more defensible interpretation is not “men have no relationships.” It is that some men may experience particular forms of connection, help-seeking, or recognition differently—and that the mechanisms deserve direct study.
This is what good cultural interpretation does. It replaces a sweeping diagnosis with a sharper question.
Situated reasonableness
Life that Counts uses situated reasonableness descriptively, not as a validated theory or measurement scale.
A choice can appear reasonable within the situation as a person experiences it, even when longer-term costs are obscured, discounted, or accepted in the moment. The immediate problem may be belonging, intimacy, relief, safety, status, control, identity, or escape from humiliation.
This does not make the choice wise. It does not make harm morally relative. And it does not mean culture “made” the person act.
It means that prevention and formation must ask a more demanding question than “Did they know the rule?” A person may know that a behavior is dangerous and still perceive it as the most identity-congruent, socially protective, emotionally relieving, or immediately rewarding option available.
A warning can establish that a behavior is dangerous without making the healthier alternative visible, respected, practiced, or possible.
Consider the difference between two messages. “Do not use this substance” names a boundary. “Here is how to enter a community where your courage, grief, boredom, and need for belonging can be carried without the substance” begins to build a route. “Avoid a harmful relationship” names a danger. “Here is how reciprocal love develops, how trust is tested, how loneliness can be survived, and where reciprocal, trustworthy relationships can be formed” supplies a script.
Boundaries matter. But a boundary without a believable future on the other side can lose a contest with an immediate need.
This account avoids two errors: reducing a decision to individual knowledge and will alone, and treating the person as powerless before the environment. The person remains responsible, while the environment affects how visible, costly, supported, and promising the responsible choice appears.
When social systems change on different clocks
The realignment data suggest another Life that Counts working concept: transition mismatch.
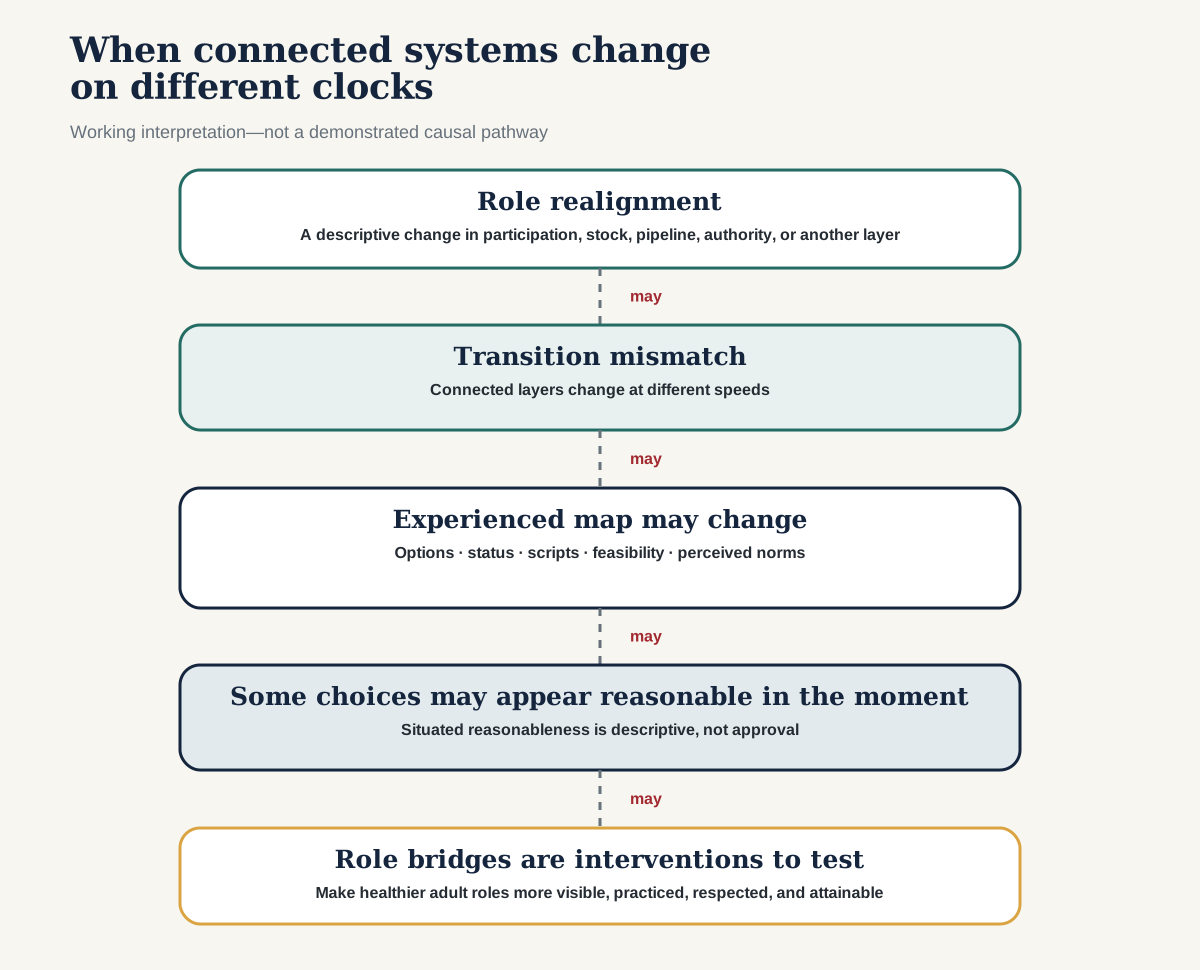
A transition mismatch occurs when connected layers of social life change at different speeds. Educational pipelines can change faster than occupational stocks. Occupational participation can change faster than leadership. Economic requirements can change faster than family and courtship scripts. Formal opportunity can change faster than informal status expectations. Digital visibility can change faster than communities can correct misperceived norms.
Transition mismatch is a working interpretation, not a causal finding from the descriptive data above. The proposed chain is conditional: role realignment may create mismatch; mismatch may alter experienced options, status, scripts, feasibility, or perceived norms; those changes may make some choices appear more reasonable in the moment; and bridges into healthy adult roles are interventions designed to test whether clearer, more attainable pathways change perceptions and outcomes.
Consider the kinds of conflicting instructions such a mismatch may generate. A young woman may be encouraged to pursue any profession while encountering care obligations, safety concerns, or workplace expectations that make some paths more costly than the message implies. A young man may struggle to translate inherited ideals of usefulness—competence, provision, service, fatherhood, and leadership—into a changed labor and family landscape, especially when no trusted adult or institution models the transition. A family may affirm the value of stable commitment while confronting work schedules, housing costs, childcare burdens, and social scripts that make commitment harder to form and sustain. A rural teenager may be told that success requires leaving, even while the community says loyalty means staying.
These examples are hypotheses about decision environments, not proof of one historical cause. The observed sex-patterned changes in education, work, voting, and licensing do not by themselves explain adolescent risk, family instability, delayed marriage, loneliness, or male disengagement. Cross-domain similarities are clues. Causal claims require direct evidence linking a mechanism to an outcome.
Still, the mismatch is worth investigating because culture and institutions can unintentionally separate virtue from viability. A society may praise responsibility while making responsibility difficult to practice. It may expand options without supplying scripts. A social role can change without communities finding new ways to organize the legitimate needs for contribution, belonging, care, provision, and protection that it once carried. A society may condemn a behavior without creating a community in which the underlying need can be met differently.
The answer is neither nostalgia nor novelty for its own sake. The question is what is worth preserving, what must be repaired, what should be relinquished, and what new forms can carry durable goods—courage, fidelity, competence, care, provision, self-command, sacrifice, and service—into changed conditions.
Building bridges into healthy adult roles
If connected layers of social life change at different speeds, one response worth testing is the creation of credible bridges into healthy adult roles.
A role bridge is a relationship, institution, or repeated practice that connects a person’s present identity and abilities to a credible, socially valued adult role through attainable steps, real responsibility, and reciprocal belonging.
Such bridges should expand agency rather than prescribe a sex-specific destiny. They may respond to sex-patterned barriers without treating aggregate patterns as instructions for any individual.
It is more than advice. A genuine role bridge provides:
a visible destination;
a sequence of achievable steps;
modeling and apprenticeship;
meaningful responsibility rather than symbolic participation;
recognition for contribution;
proportionate correction, opportunities for repair, and a route back where safety permits;
practical access, including time, transportation, tools, and introductions; and
a next step after failure.
Mentoring, skilled-work pathways, peer leadership, service, family preparation, accountable adult relationships, civic contribution, and school-to-work partnerships may function as role bridges. But the phrase should not become another slogan. Each program is a hypothesis: for whom does this bridge work, through what mechanism, under what conditions, and with what evidence of durable benefit?
The design implication is a hypothesis to test. If a harmful behavior supplies belonging, status, relief, or identity, simply discouraging it may leave the underlying need unaddressed. A program should not merely make danger more vivid; it should examine whether a healthier role can be made more visible, practiced, respected, and attainable—and whether that change improves outcomes.
This is not an argument for manufacturing one approved life. People differ in gifts, callings, constraints, and responsibilities. It is an argument for ensuring that healthy adulthood remains both morally legible and practically reachable.
How to interpret culture without inventing a story
The inquiry behind this article produced a discipline as much as a conclusion. To keep interpretation honest, label each statement as a descriptive estimate, measured association, demonstrated causal effect, plausible mechanism, working interpretation, or moral judgment. A causal claim requires a design capable of ruling out credible alternative explanations within a defined context; a coherent story is not enough. Confusion begins when a numerical disparity quietly becomes a causal story, and the causal story becomes a moral verdict presented as though the dataset itself delivered it.
A better interpretation asks:
Are we measuring a stock, flow, pipeline, participation rate, authority, intensity, or risk?
Is the comparison within a group or a share of the total?
Are the sources truly comparable across years?
Does the national average conceal important local or subgroup variation?
Are we describing what people do, what they believe others do, or what they believe others approve?
What evidence would disconfirm our preferred explanation?
Which part is evidence, which part is inference, and which part is conviction?
This standard does not drain moral purpose from the work. It protects moral purpose from being built on a false account of reality.
The work ahead
Culture is more than the opinions people express: it supplies meanings, expectations, and scripts. But the futures people can imagine and reach also depend on institutions, material conditions, relationships, and technologies.
That is why cultural change can be both liberating and disorienting. New pathways can open while old forms of meaning weaken. Inherited expectations can preserve wisdom while failing to fit new conditions. Institutions can offer permission without preparation, access without belonging, or ideals without feasibility.
The response should not be panic. It should be disciplined attention.
People do not choose from every option that exists on paper. They choose from the options they can see, understand, afford, imagine, and survive socially.
The practical task is therefore twofold: interpret the cultural map truthfully, and build credible bridges from present circumstances into healthy adult roles. That requires clear standards, but also models, practice, access, belonging, and a next step after failure.
Personal responsibility remains indispensable. So does institutional responsibility for whether honorable choices are visible and reachable. Taking culture seriously means holding both.